
All Things Considered: Combining Erg Corrections
Michael P.C. Watts
Lots of clubs train very diverse groups of athletes at the same time; here is a way to compare and predict relative performance on the water.
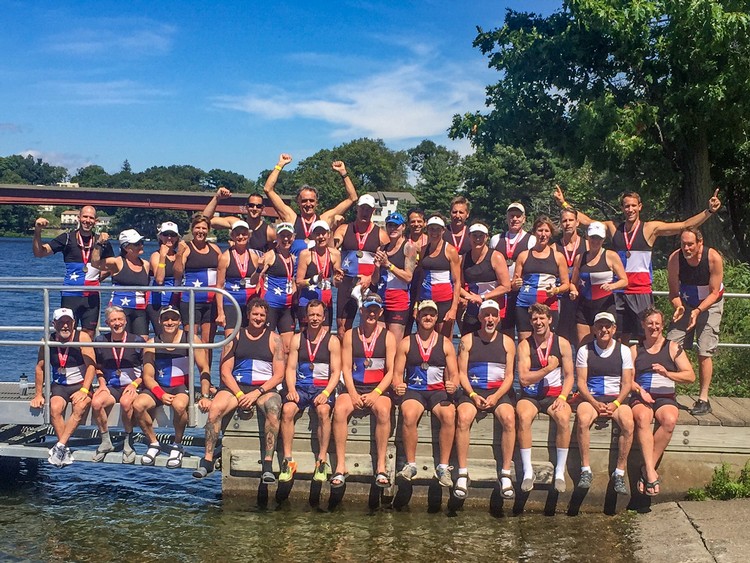
At the Texas Rowing Center, Mark Borchelt, our masters team coach, inflicts erg tests on his voluntary athletes. The victims are a pretty diverse group; from some tiny 60-year-old plus women, to a few 6'5" men, and everything in between.
Of course, the old claims that raw times do not reflect true boat moving ability, or an individual's excellent physical condition, keep coming up. So, we decided to investigate whether published age, and weight and sex correction factors enabled a fair comparison across the squad.
We found that it does! The corrected erg scores do not indicate which athletes will win a race - the youngest and fittest will likely win. But it does remove most of the variation in the sample, leaving just rowing fitness and erg technique as the residual factors. Interestingly, the athletes that collect most medals at Nationals Masters across all weights and ages generally had the better corrected times, suggesting that the corrected results give an indication of masters race performance.
Raw Performance
The TRC masters racing team that participated in the erg test consisted of 28 men and 9 women. Ages ranged from 33 to 71 and weights from 109 to 230 pounds. The team members had a wide range of rowing experience including novices of all ages, returning rowers with high school or college experience, and an ex-national team member and an ex-Olympian. The raw times for 1000 meters varied from 2:57 to 4:43, a range of 106 seconds. The dependence of raw time on sex, age and weight can be seen in Figure 1 below. It is important to note that the trends in the raw data are skewed because the team is disproportionately populated by large young men, and a very successful group of small 60 something women.

The weight variation shows that the raw times for the lighter athletes were significantly slower.

The age variation shows that past age 60, the raw times slow noticeably with a lot of variation caused by the different weights. The male vs. female difference are magnified because the women's team members are older and smaller.
Corrections
US rowing publishes an age handicap table of correction times to subtract from the finish times, and ergs are designed to reproduce the performance of a four on the water, so the age was corrected using the US Rowing Handicap table for fours.
Age correction (secs) = 0.0216*(age - 27)^2
Concept2 have published a weight correction factor calculator that provides a multiplier that reduces the finish time, normalized to a 270 lb athlete. The Concept2 weight correction factors were collected at 10 lb intervals. The correction factor was found to be a power law function of weight. The equation below was used in a spreadsheet to calculate the corrections for the team.
Weight Multiplier = (weight/270)^0.222
The sex correction was based on a published study of rowers that showed that males were 10% faster than women. The final times for the women were multiplied by 0.9.
There is an additional complexity because the age correction is a subtracted factor, whereas the weight and sex correction are multiplied factors.
As result, there is a small difference depending on the order that factors are applied. The sex caused variation was the largest, next was weight, and last was age. When the age correction was applied first, the residual age and weight variation was minimized to less than 5%. The final equation was as follows;
Corrected time = (Raw time - Age Correction) *Weight Multiplier * Sex Multiplier
Corrected Times
The corrected times for men and women are plotted below and show no obvious trends with either age weight, or sex. It appears that the playing field is pretty level, using the corrections that were based on independent sources, with no fitting to the raw data.


(Please note, the corrected times are a referenced to a nominal 27 year old, 270 lb, male athlete, so the times are for comparison to other corrected times only.)
An online calculator for corrected times is available here.
The variation in time for the team was reduced from 106 seconds to 44 seconds for 1000 meters. If you look at the handicaps as a measure of decline in performance with age, the US rowing numbers are comparable to 50 m swimming declines. They are less than the decline in marathon times and peak VO2 performance. This seems consistent with the idea that aerobic performance drops quicker with age than anaerobic performance.
Conclusions
Our analysis shows that the accepted factors used for age correction in masters rowing, concept2's weight correction and published data for differences between the sexes can be combined to produce a reasonably level playing field. The resulting times do not predict on the water times, but can provide a basis for friendly competition in a very diverse group of athletes.

If you enjoy and rely on row2k, we need your help to be able to keep doing all this. Though row2k sometimes looks like a big, outside-funded operation, it mainly runs on enthusiasm and grit. Help us keep it coming, thank you! Learn more.
Comments | Log in to comment |


- Bont Rowing
- Calm Waters Rowing
- Concept 2
- Craftsbury Sculling
- The Crew Classic
- CrewLAB
- Croker
- Dad Vail Regatta
- Durham Boat Co.
- Empacher
- Faster Masters
- Filippi
- Fluidesign
- h2row.net
- HUDSON
- Live2Row Studios
- Nielsen-Kellerman
- Oak Ridge RA
- Peinert Boat Works
- Pocock Racing Shells
- Race1 USA
- Rockland Rowing Masters Regatta
- RowKraft
- Rubini Jewelers
- Vespoli USA
- WinTech Racing
08/04/2017 9:59:33 AM
08/09/2017 8:27:22 PM
08/02/2017 4:08:12 PM
..... However, the unnecessary comparison with other sports and VO2 max age drop-off is mind numbing. Why? The resistance in rowing, erging and swimming is the drag force, and the Power necessary to overcome the drag force varies with the cube of the velocity. However, for long distance running the resistance force is constant and the Power necessary to overcome the resistance varies directly with the velocity. Accordingly, assuming the same relative decline in power, we would be expected that running speeds would decline proportionately more than rowing, erging or swimming velocities based on aging
.........VO2 is a measure of the volume of oxygen per minute. VO2 correlates directly with the aerobic power the body is generating. Accordingly, VO2 should correlate directly with running velocity; however, with (primarily aerobic) rowing and erging, VO2 will correlate with the cube of the velocity. And like running, we would be expect that VO2max would decline at a proportionately greater rate than rowing or erging velocity.
...... Lastly two notes. 1) I didn't go into the anaerobic and aerobic energy cost of a 1000m erg because it just gets confusing for the average reader. That said the aerobic and anaerobic costs of a 1000m all out piece will be roughly equal, and 2) I note that the authors last name is Watts and Watts are the unit of Power. If he had just back calculated the rowing data into relative Watts then the comparisons he attempt to draw would have been valid.